How to Be a Succesful Trader in the Bear Market of 2022?
Learn How to Invest with a Scientific Perspective
Let me start this post with a groundbreaking quote that you would find on the internet on some of the “educational” blogs or videos about the stock/crypto markets:
The key to becoming a successful trader is to buy low and to sell high!
Yes, that’s correct! The statement is as stupid as it sounds 😉
The reality is that the internet is full of “educational” content as the above. There are countless number of blogs, videos, social media posts, with a major focus on charting, trying to attract young or inexperienced investors to consume their content. But would you end up being the “Wolf of Wall Street” by watching such YouTube videos? Or maybe you want to be the “Wolf of Window Street”? 😉

Predicting the stock market and becoming a successful trader is not as easy. It requires knowledge, access to all kinds of data, systematic analysis, and proper tools and technologies. Jim Simon, the mathematician billionaire who is described as “the greatest investor of all time in Wallstreet” and who has earned over $100 billion in trading profits, describes his success key as the following:
- Develop a system
- Collect data and use it to optimize
- Always stick to the model/plan
- Surround yourself with the right people
- Don’t give up
How can we implement the above objectives? They don’t sound that easy. That’s true. Developing a “system”, having access to the right data, and implementing proper investing models is not a trivial task that an average investor can do on its own. A retail investor, on the other hand, cannot afford to use enterprise solutions like Bloomberg’s Terminal. But does it mean one should give up? Absolutely not! The good news is that today access to the right and relevant data is by far easier than a few years ago. The ubiquity of market data on one hand and the open-source world on the other hand, make market research and systematic analysis more successful than before. And that’s what we want to talk about: Systematic and modern market research to help you to be a successful investor.
Market Research: Principles and Tools
Market research is the practice of studying and analyzing the financial markets to find trends and patterns, understand the fundamentals of sectors and firms, develop and test hypotheses about the market, evaluate risks, and to predict future trends, to hopefully make profitable trading decisions.
As stated above, to study and research the market successfully, you need data and tools. At Investoreight, we believe the research tools should be accessible and affordable for all investors. We also think that collective and collaborative research would help investors to focus on the core of their investing strategies rather than the primitive and yet cumbersome efforts to setup a proper “system”. That’s why we introduce i8 Terminal, our open-source solution for modern market research.
i8 Terminal is a modern Python-based solution with superior power and flexibility to understand and research the market. Among many features, with i8 Terminal you can analyze and compare securities with built-in or custom metrics, create modern and custom visualizations, and implement your own custom commands or strategies.
Learn some of the features of i8 Terminal on our website.
You need to of course have the data and proper models and platform to manage it. That is one of the heavy things that i8 Terminal has already lifted for you. We use our centralized Investoreight platform to process and supply data for i8 Terminal and to manage your charts, analysis, and custom strategies. It goes without saying that with our open-source solution, you can always integrate and connect to any third-party data providers to further enrich your analysis.
So, how can I be a successful trader?
I am going to write a series of blog posts to further educate you with systematic market research using i8 Terminal. For now, I am providing some general hints with a few glimpses of i8 Terminal. Here are some of the general rules:
- Understand the company you want to invest
- Start with one or two firms and analyze them further
- Compare the firm with its peers, its past, and the sector it belongs
- Don’t blindly follow buy or sell recommendations from Analysts. Just use them as an additional source of information to make trading decisions.
- To understand the financial strength of a company, you should understand the company’s financial statements. Learn more about income statement, cash flow statement, and balance sheet
- Learn what is the current state of the stocks you want to invest? Are they growing stocks or value stocks?
- Learn the common metrics and multiples that describe the financial health, growth, and profitability of companies. We describe them briefly here. You can also get a description of financial metrics using i8 Terminal's metrics command.
- Develop a systematic approach to evaluate the stocks you want to invest in before making the final buy/sell decision
Now to give you a flavor of i8 Terminal, let me demonstrate a simple methodology to compare and pick a stock to invest in. You can also run the same analysis with a Free i8 Terminal account.
Download / Install i8 Terminal
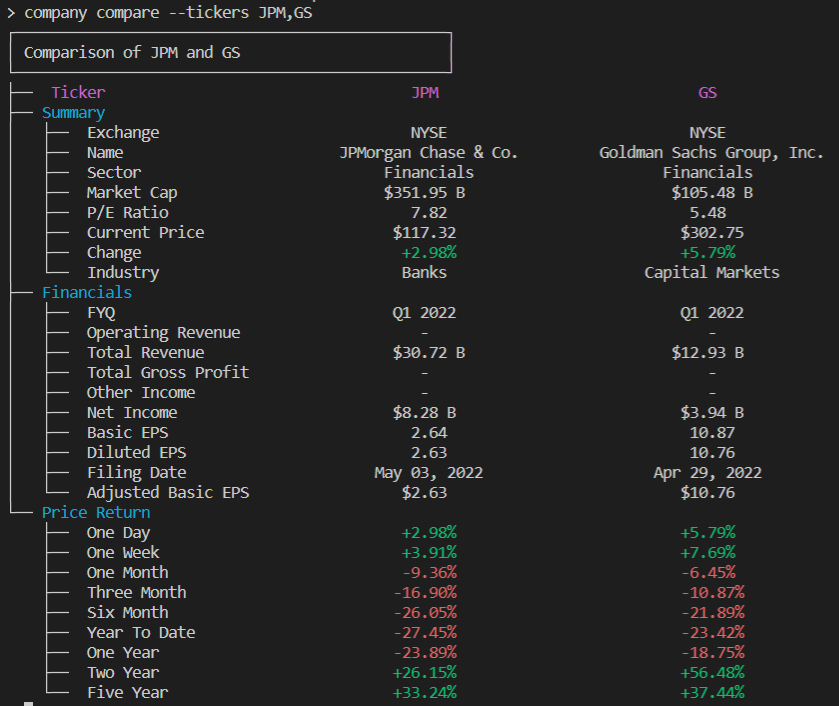
For this example, I am interested to analyze and compare two firms from the financial sector. Let’s get a quick overview of the two stocks by the following command:
> company compare --tickers JPM,GS

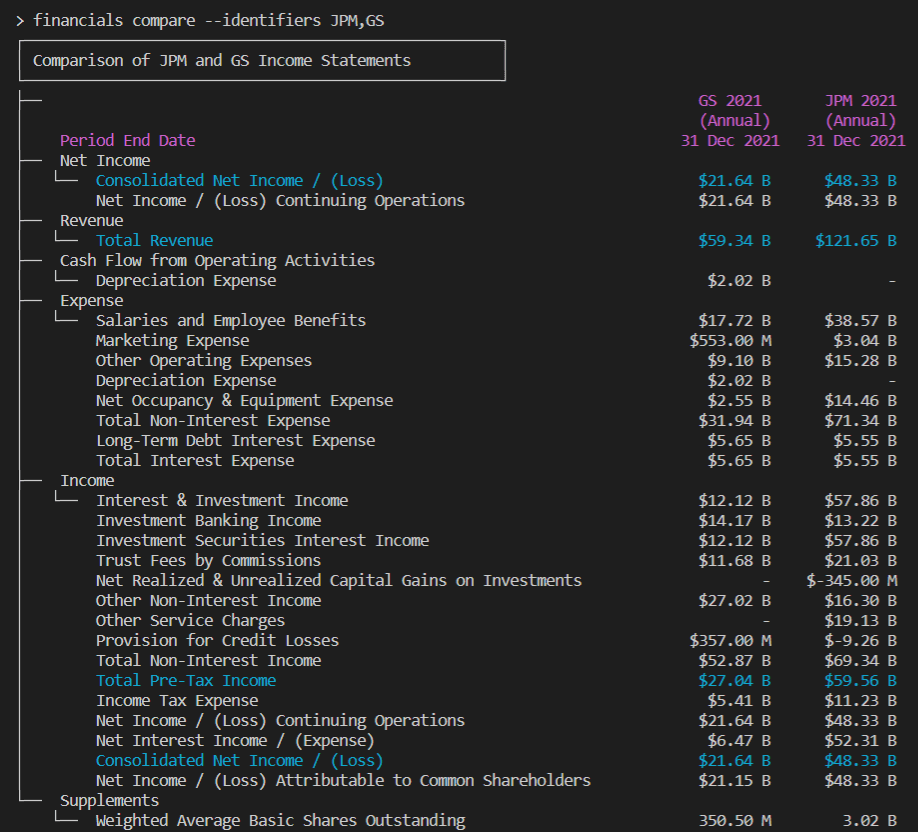
The above command gives you a summary of the two firms together with an overview of the financials and performance metrics (Note that you can customize this view). The two companies have very similar performance though GS seems to slightly perform better over different periods. It is also interesting to see that GS is having a lower earning per share (P/E ratio) thus making it more favorable in terms of valuation. You can compare the detailed financials of the two companies with each other or with their past. Detailed analysis of the company's financials is outside the scope of this post, but to give you an idea, you can get a comparison of the firm’s financials with the following command:
> financials compare --identifiers JPM,GS
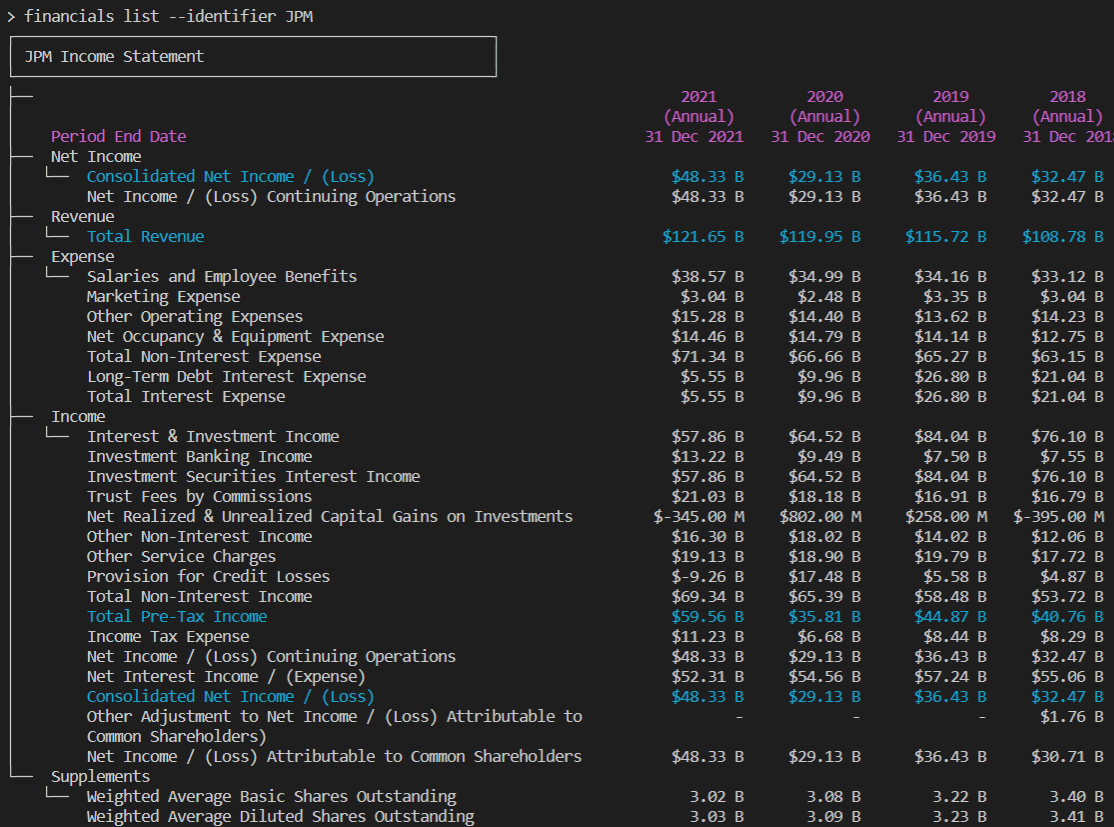
You can also list the historical financials of each firm with the following command. Note that both commands by default list the “income statement”. If you want cash flow or balance sheet you just need to add an extra option to the command (See the detailed documentation). You can see the output of the two commands below.
> financials list --identifier JPM


We leave the analysis of the two company financials for a different post. Next, I get an overview of the risk of the two firms compared to their return, to have a sense of their return/risk trade-off. This can be done simply using the “metrics” command by which you can query and list all kinds of metrics
> metrics list --tickers JPM,GS --metrics return_1w,return_1m,return_1y,return_5y,beta_1w,beta_1m,beta_1y

It seems that for all periods, GS has a slightly higher risk, but the return is also slightly better. Given that the long-term risk of GS is still not very high (almost the same as the benchmark), I would probably choose GS due to its higher historical return.
Let me conclude this post for now by reiterating that making a consistent profit in the stock market is very hard. You need to study, analyze and develop scientifically ground strategies. With i8 Terminal we hope to be able to make your research easier and more solid. Stay tuned and happy investing!